01
Financial Statements
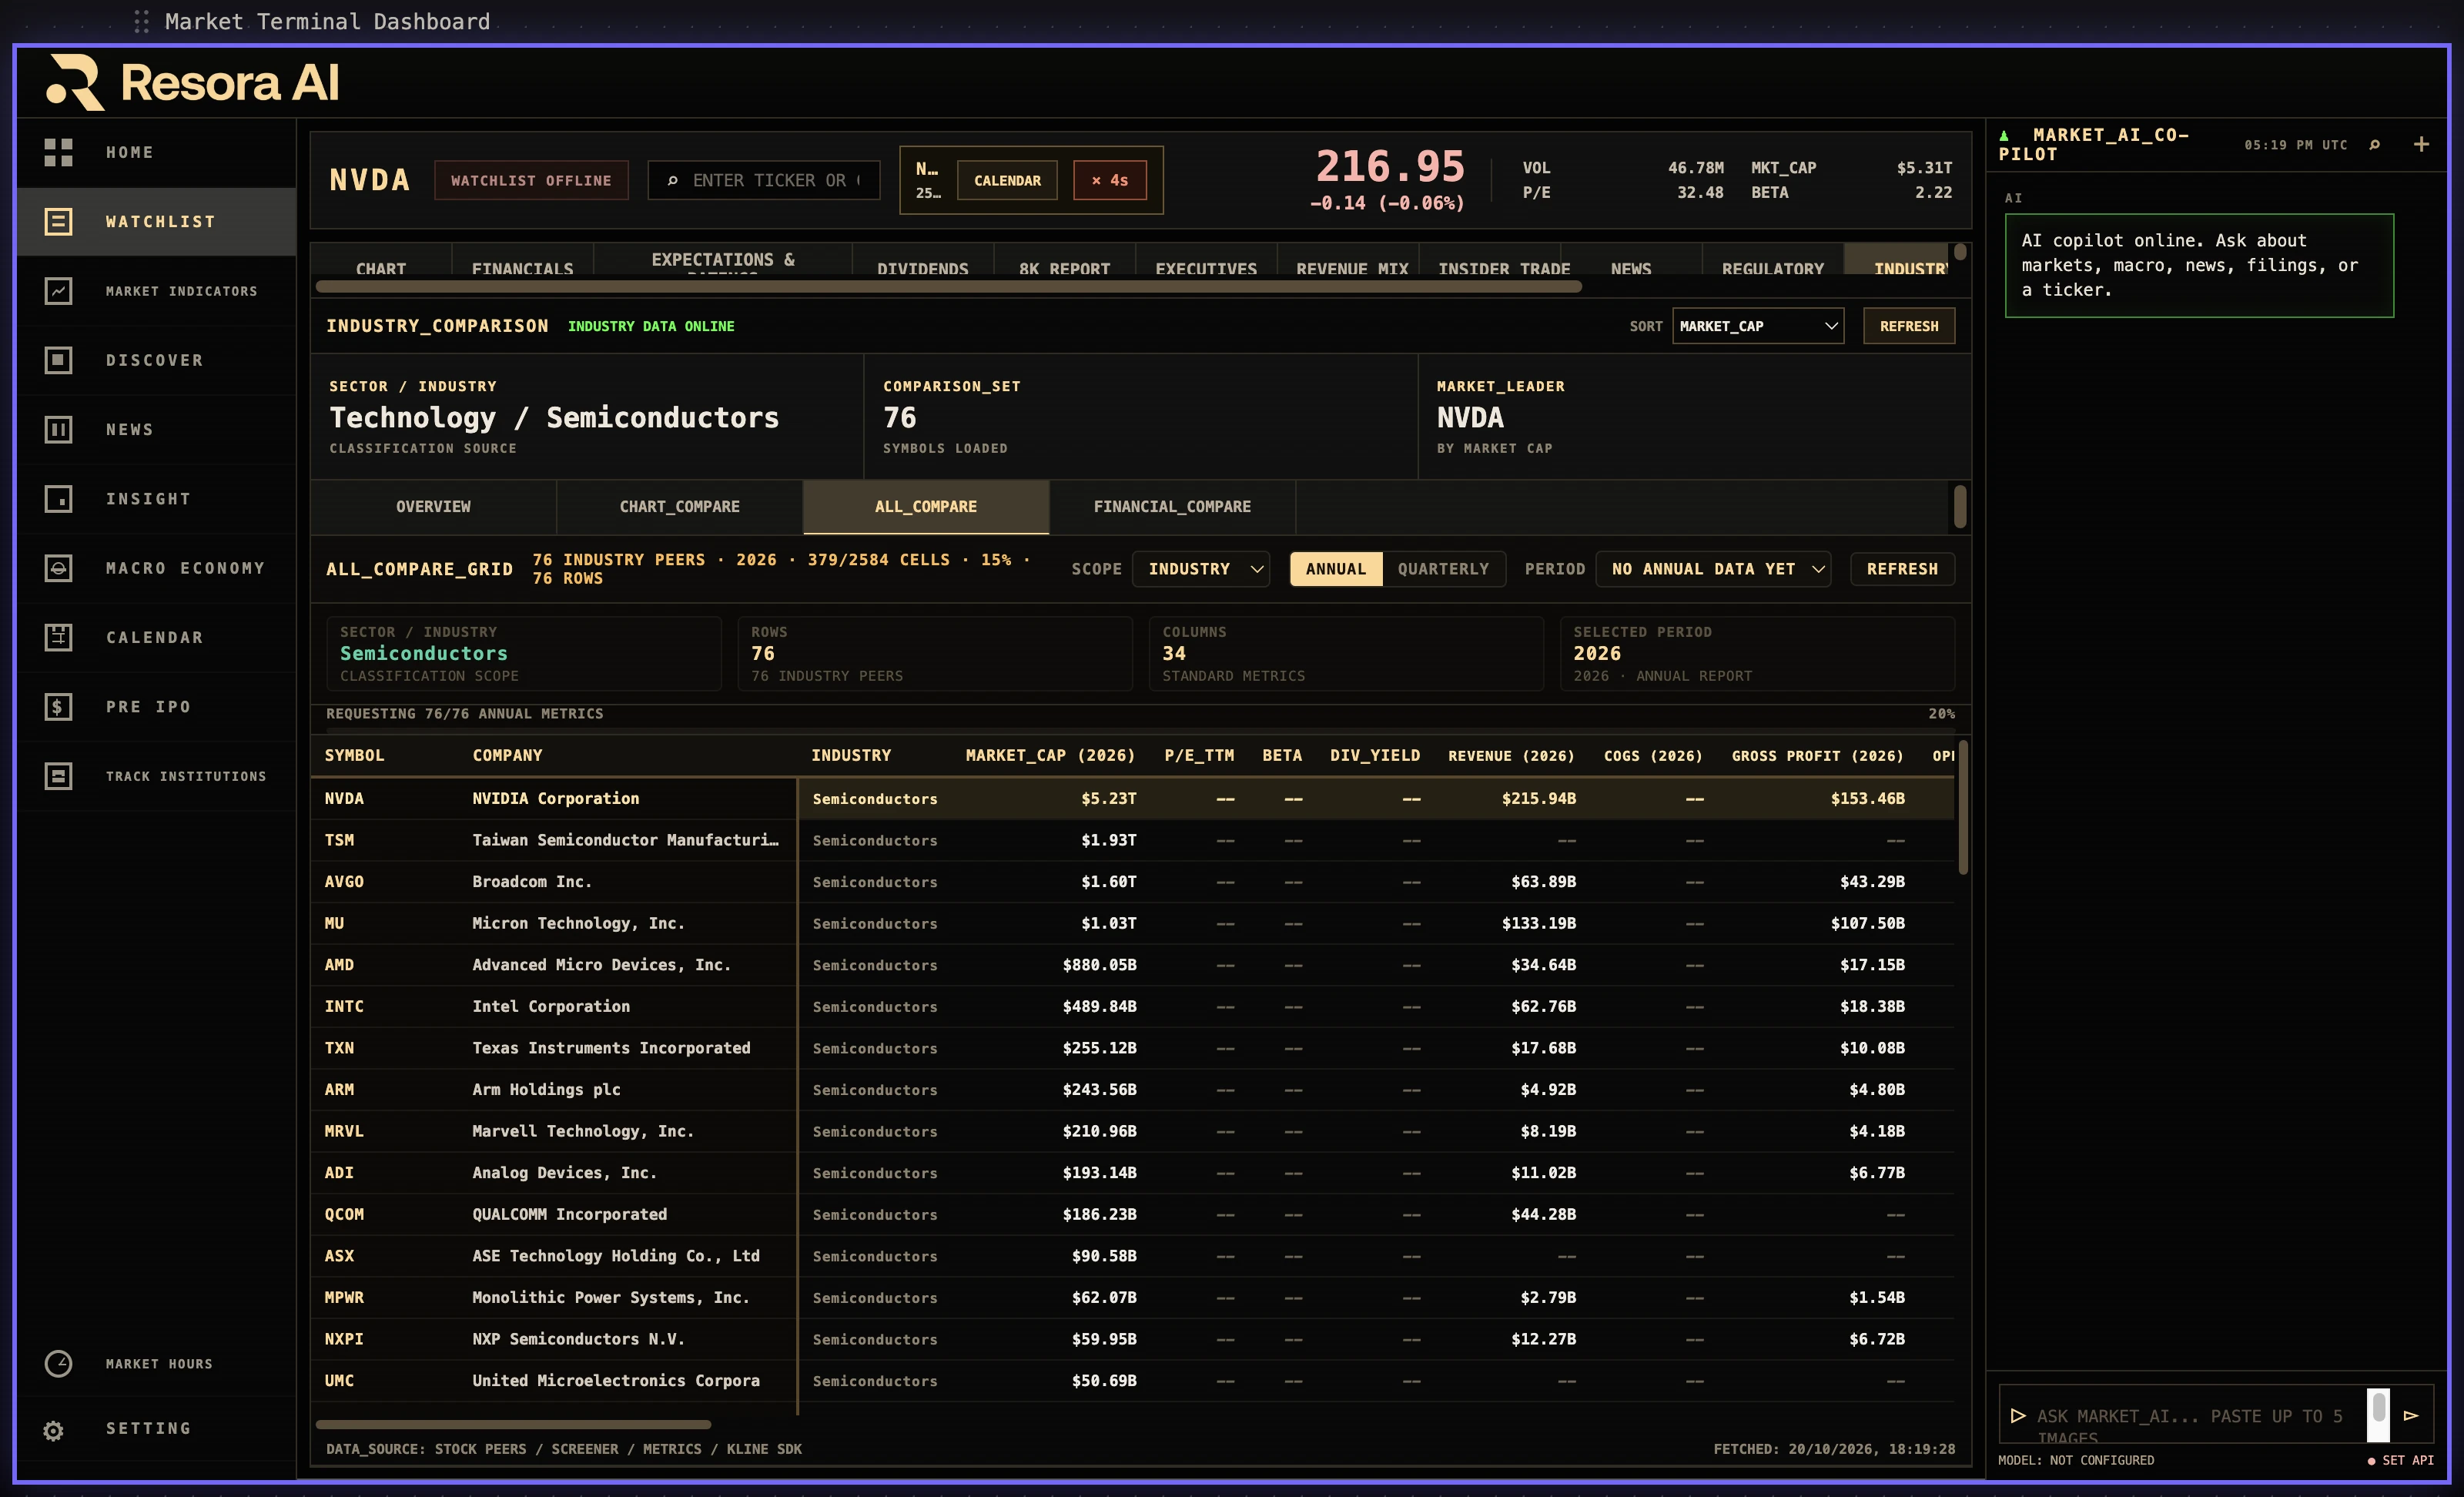
3,585,408 statement rows and computed metrics for 6,260 companies, annual or quarterly, each traceable to the XBRL facts and the filing that reported them.
XBRL
Resora is a research terminal for U.S. equities built on primary sources. As of 2026-11-02 the production tables hold 6,384,212 insider transactions parsed from 2,453,189 SEC Form 4 filings across 10,260 issuers, 411,902 13F institutional reports from 1987 onward, 3,585,408 financial statement rows, quarterly and annual metrics for 6,260 companies, 33,675 earnings call transcripts, 527 macro series with readings back to 1897, and 455,768 options snapshots. Each figure keeps the accession number or series ID it came from and the time we retrieved it, so a number can be checked instead of trusted. The web terminal is free with an account.
ROW COUNTS MEASURED FROM PRODUCTION TABLES ON 2026-11-02
Every number below is a COUNT(*) or a MIN/MAX on the live tables, not a marketing estimate. Where a source uses a paywalled field, the substitute source is named. The method section explains how a figure reaches this table.
| Dataset | Records | Earliest → latest | Primary source | Refresh |
|---|---|---|---|---|
| Insider transactions (Form 4) | 6,384,212 rows · 2,453,189 filings · 10,260 issuers | 1990 → present | SEC EDGAR Form 4 XML | daily |
| Institutional holdings (13F) | 411,902 reports | 1987-03-31 → 2026-06-30 | SEC EDGAR 13F | quarterly |
| Fund & manager holdings | 3,017,033 fund rows · 3,012,594 manager rows | rolling window | issuer files, cross-checked against finviz screens | daily |
| Financial statement rows | 3,585,408 | per filing history | SEC XBRL facts + filing table extraction | per filing |
| Computed metrics (quarterly / annual) | 219,206 · 68,326 rows over 6,260 companies | per reporting period | derived in-house; formulas published on the metric pages | earnings season |
| Earnings call transcripts | 33,675 | 2020-01-06 → 2026-10-31 | public transcript feeds | per call |
| Macro & economic series | 1,891,127 readings · 527 indicators | 1897-12-01 → present | BLS + FRED (full history, key-free) | per release |
| Index daily bars | 243,837 bars | 1984-02-14 → present | exchange-derived index history pipeline | daily |
| Price snapshots | 3,310,300 rows · 5,550 symbols | rolling intraday | exchange quote feeds | intraday |
| Options data | 455,768 chain snapshots · 31,003 CBOE rows | rolling | CBOE + exchange chain feeds (L0–L5) | 4 sessions/day |
| Financial news corpus | 223,177 stories | rolling, hourly ingest | public newswires (69 feeds) | hourly |
| SEC enforcement actions | 26,011 events | archive depth | SEC litigation releases | daily |
| Economic & earnings calendar | 365,445 events | forward and backward | official release calendars | daily |
| Segment & supply-chain structure | 1,639,882 product links · 622,676 region links | per disclosure | 10-K/10-Q segment and disclosure text | per filing |
| ETF daily holdings | 18,379 rows · 25 funds · 234 constituents | 2026-07-14 → 2026-11-02 | issuer holdings files | daily |
| Delisted-company universe | 48,490 master CIKs · 29,839 delisting candidates · 34,638 CIK–ticker pairs | 1998 → 2026 (build 2026-10-25) | SEC EDGAR bulk archives, open-sourced as secdata | versioned |
Notes: totals are approximate InnoDB row estimates for tables above one million rows and exact counts below that. Form 4 transaction dates contain source-side noise (a small number of impossible values), so date filters in the terminal use the filing date. Fund and ETF coverage is a rolling window rather than full history. Financial history depth varies by company and by when it began reporting in XBRL.
3,585,408 statement rows and computed metrics for 6,260 companies, annual or quarterly, each traceable to the XBRL facts and the filing that reported them.
XBRLPut companies side by side on the same formulas — valuation, margin, growth, balance sheet — instead of mixing vendor definitions. 68,326 annual and 219,206 quarterly metric rows behind the table.
COMPARISON1,639,882 product links and 622,676 region links extracted from segment disclosure, so a growth claim can be attributed to the line that produced it.
BUSINESS MIX6,384,212 Form 4 transaction rows from 2,453,189 filings, plus 411,902 13F reports since 1987 and 6.0M fund and manager holding rows. Every row keeps its accession and footnote evidence.
OWNERSHIP527 indicators with 1,891,127 readings from 1897, 243,837 index bars from 1984, sovereign yield curves and a 365,445-event release calendar in one time axis.
MACRO DATA33,675 earnings call transcripts from 2020, 223,177 news items refreshed hourly, 26,011 SEC enforcement events and the filings they reference, next to the reported figures.
SOURCE RECORDSHOW A FIGURE GETS HERE
A value in Resora is the output of a pipeline, not a screenshot someone retyped. The same five steps apply to Form 4 rows, XBRL facts and BLS series, and the last step is what makes the first four checkable.
SEC EDGAR bulk archives and filings, BLS and FRED series, CBOE and exchange feeds, issuer holdings files, public newswires. Fetched on a schedule with polite throttling, retries and a cursor so a gap is visible rather than silent.
Structured formats first: XBRL facts, Form 4 and 13F XML, filing tables. Text extraction only where no structured field exists. Nothing is typed by hand.
CIK and ticker mapping across name changes and delistings, unit and currency alignment, one formula per metric so two companies are actually comparable.
Cross-source comparison where a second free source exists, range and sign checks, and restatement handling so a revised figure does not silently rewrite history.
Each row carries its accession or series ID and the retrieval timestamp. The terminal shows both, which is the difference between data and a claim.
THE PART MOST RESEARCH TOOLS LEAVE OUT
Resora publishes measured data and where it came from. No ratings, price targets, buy signals or model portfolios — because none of that is verifiable the way a filing is.
Nothing on the interface is paid for by a broker, fund or data vendor. Screen order is not for sale, and there are no sponsored lists.
We are not a broker and route no orders, so there is no payment-for-order-flow conflict behind what you see.
Your watchlists and searches are yours. We do not train models on them, resell them, or hand them to data brokers.
FREE
Runs in the browser on the same production data as the desktop app: every workspace in this page. Registration required; no card.
Open it now ↗SUBSCRIPTION
macOS and Windows, offline-capable caches, local data store and long-history panels. Monthly and lifetime plans with a trial; prices shown in the app at release.
PROGRAMMATIC
Terminal data endpoints serve signed-in clients today; symbol search is open without a token. A documented anonymous read-only subset for scripts and AI agents is the next step, and its status is stated plainly on the docs page.
Read the API notes ↗Full comparison, limits and what is excluded per plan: Pricing.
REAL PRODUCT SCREENS, NOT MOCK-UPS
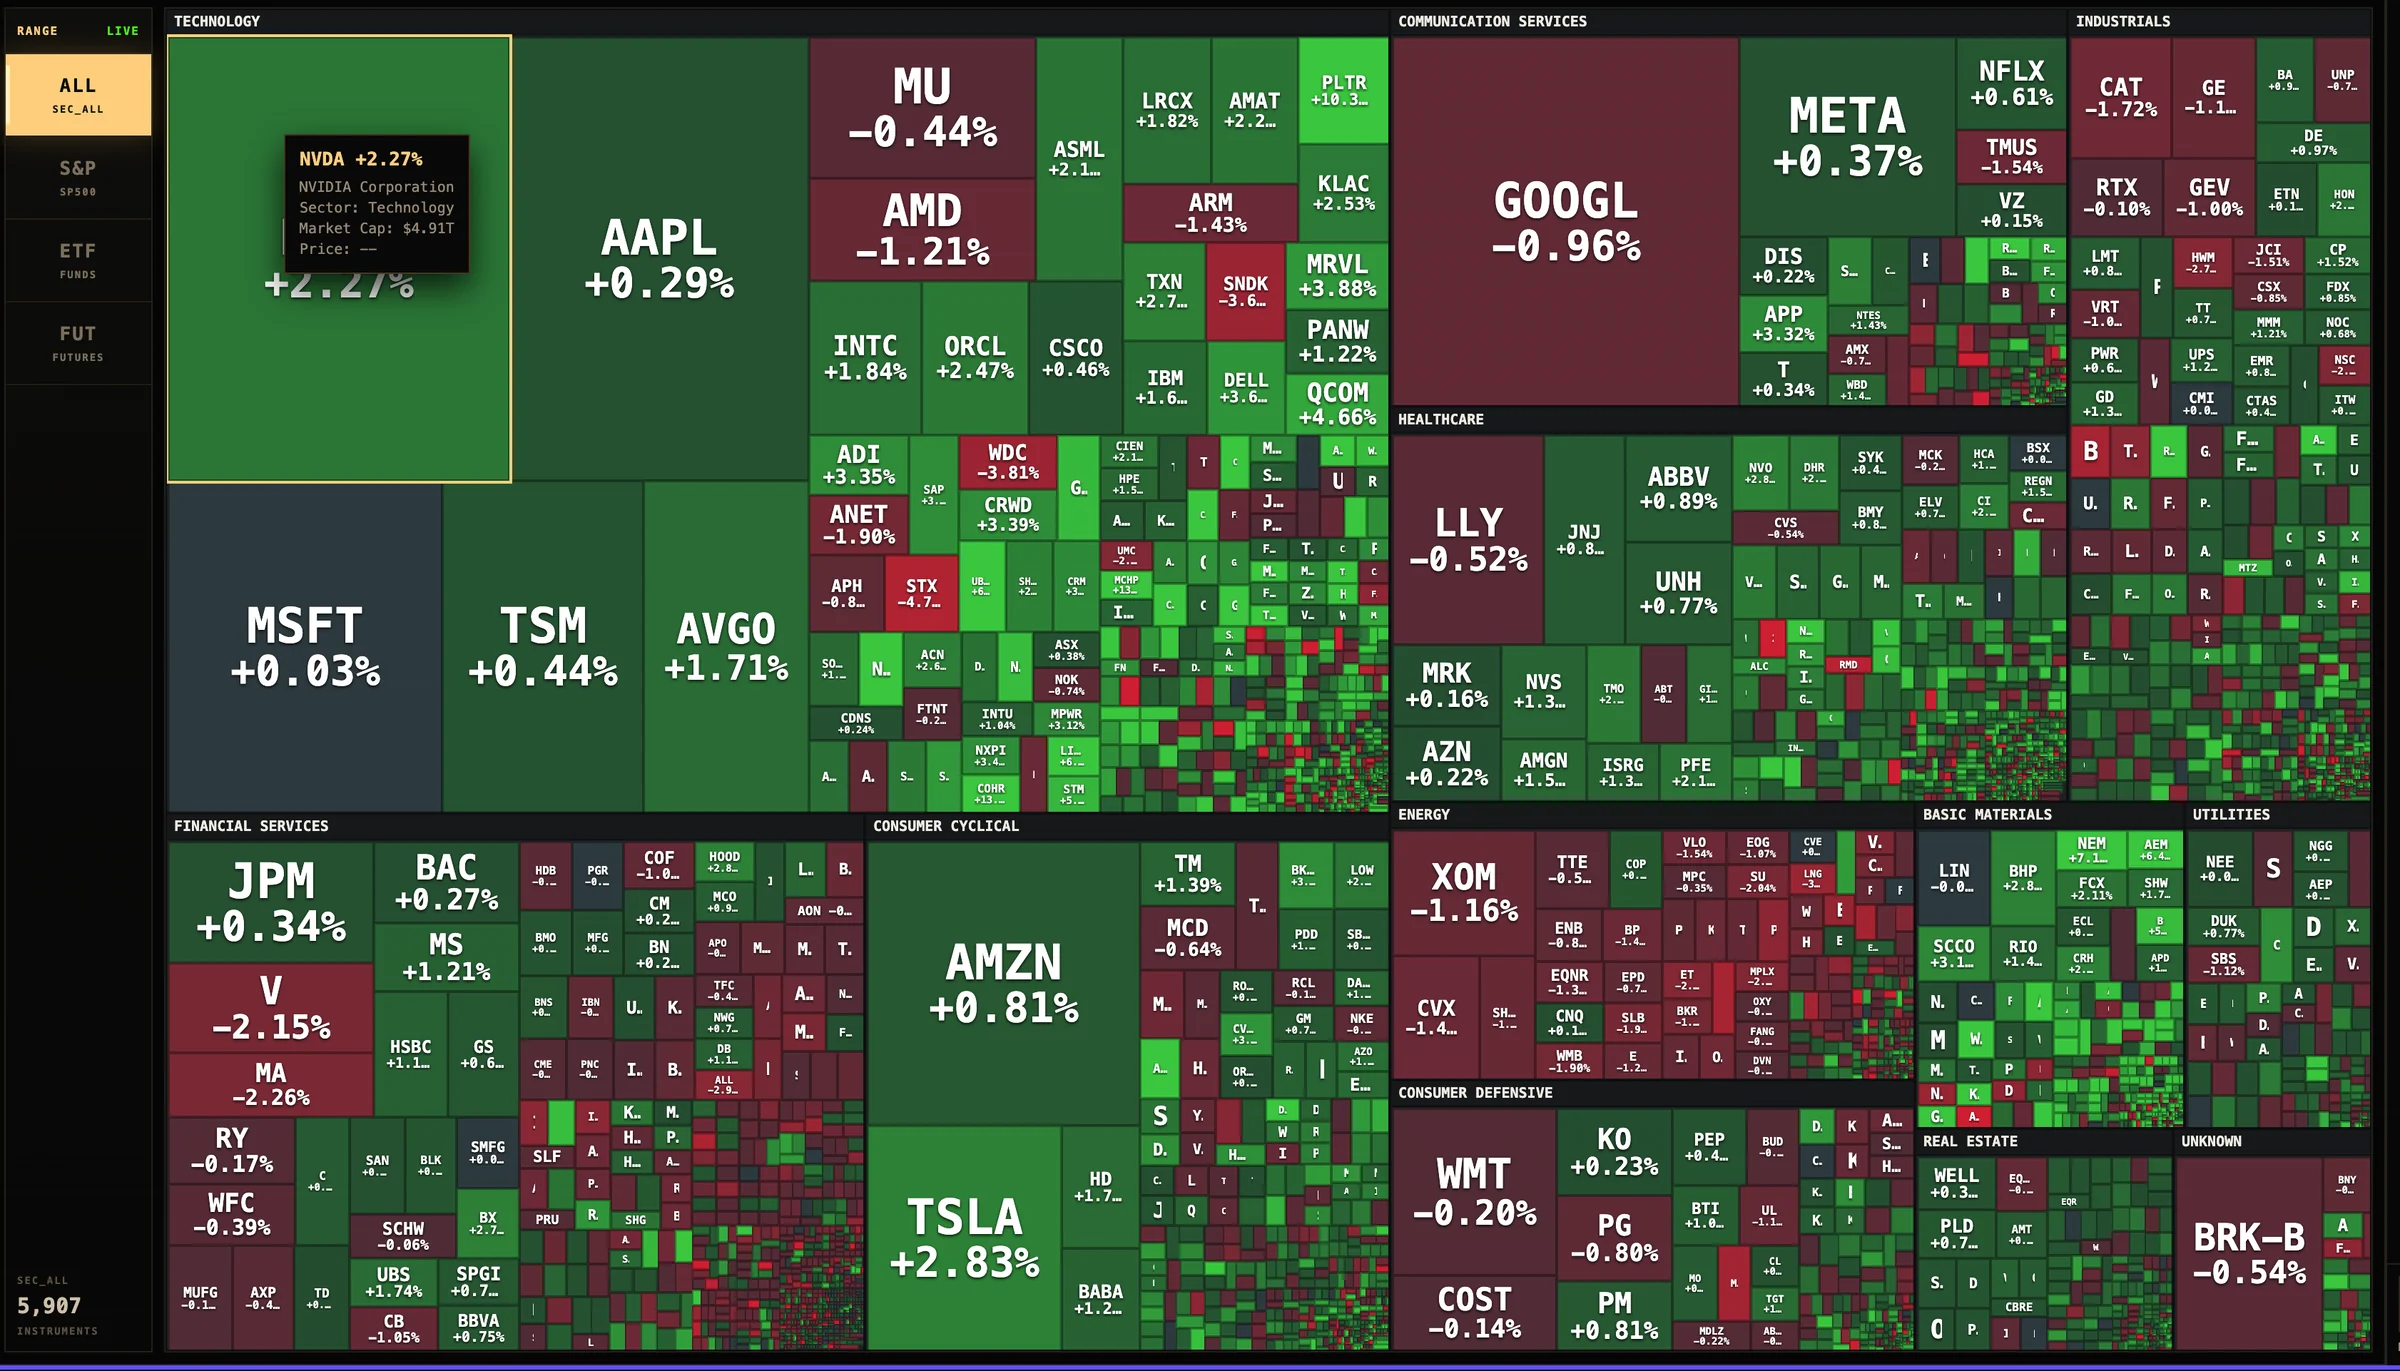
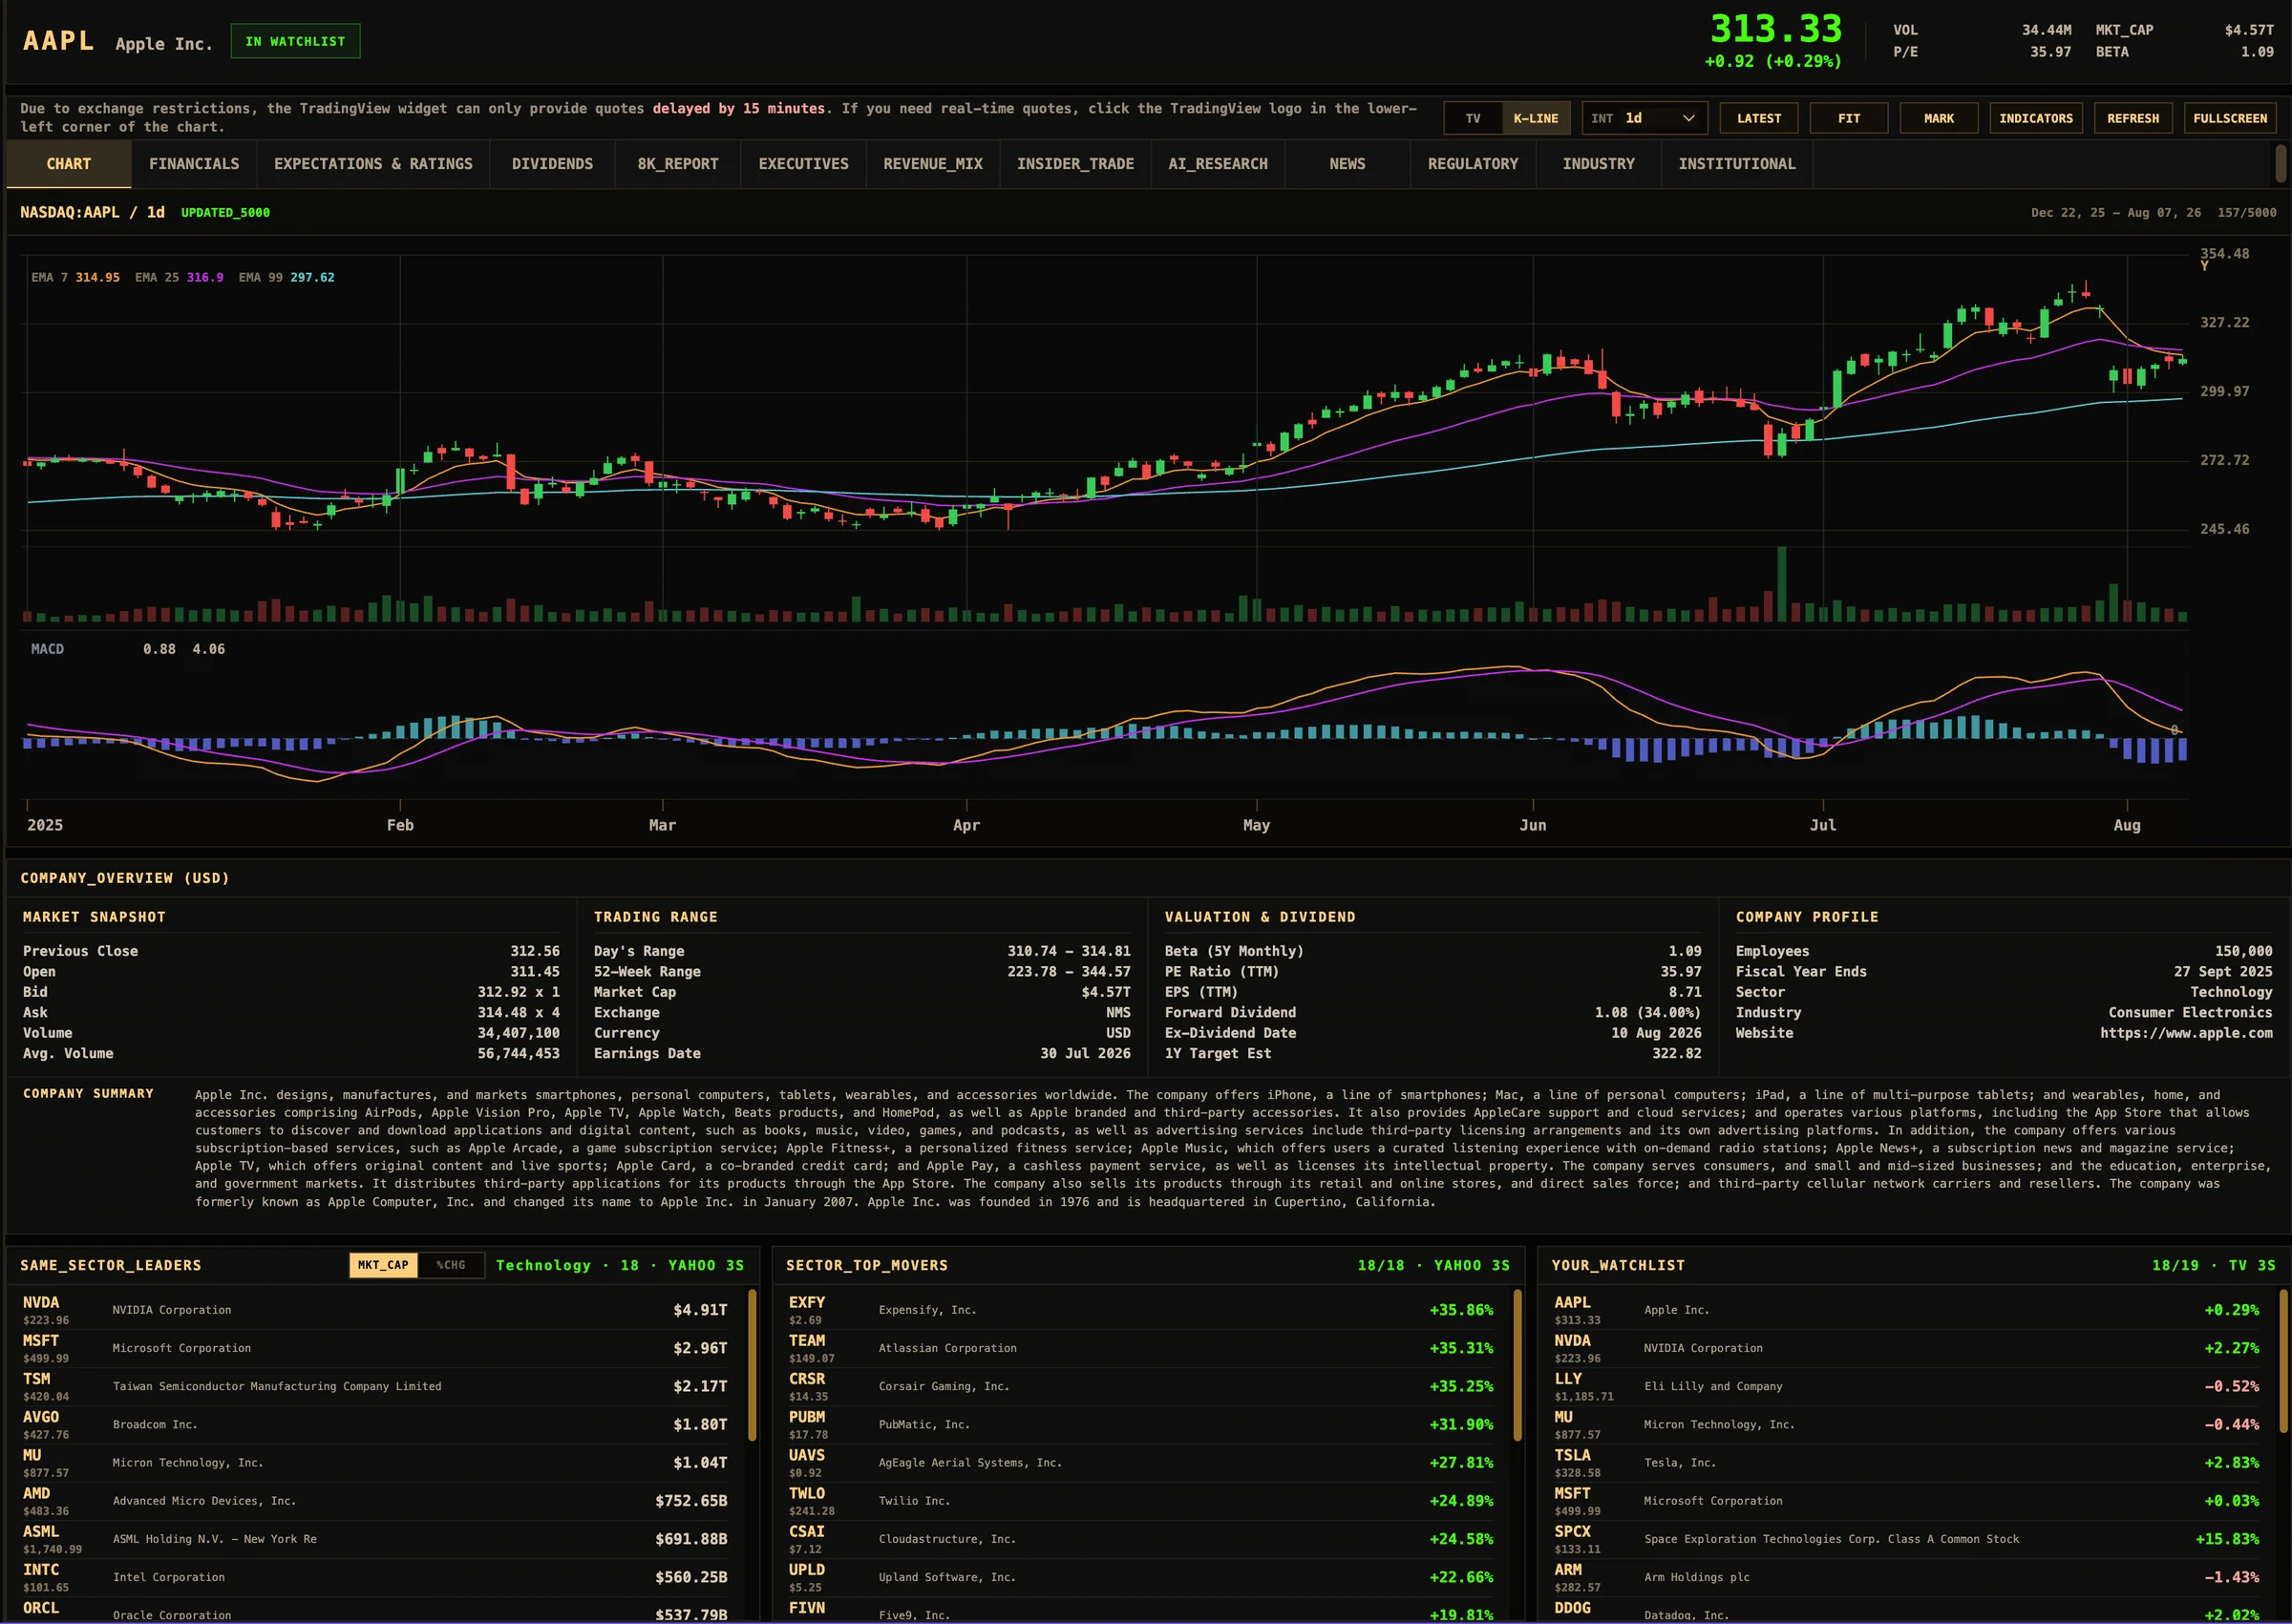
Every image on this page and in the gallery is a capture of the shipping terminal — 29 documented workspaces covering comparison, financial history, revenue composition, ownership, filings, transcripts, dividends, insider activity, ETF directory, macro boards and world map, sovereign bonds, heatmaps, calendars, pre-IPO filings, ratings and charting.
Open Interface Gallery ↗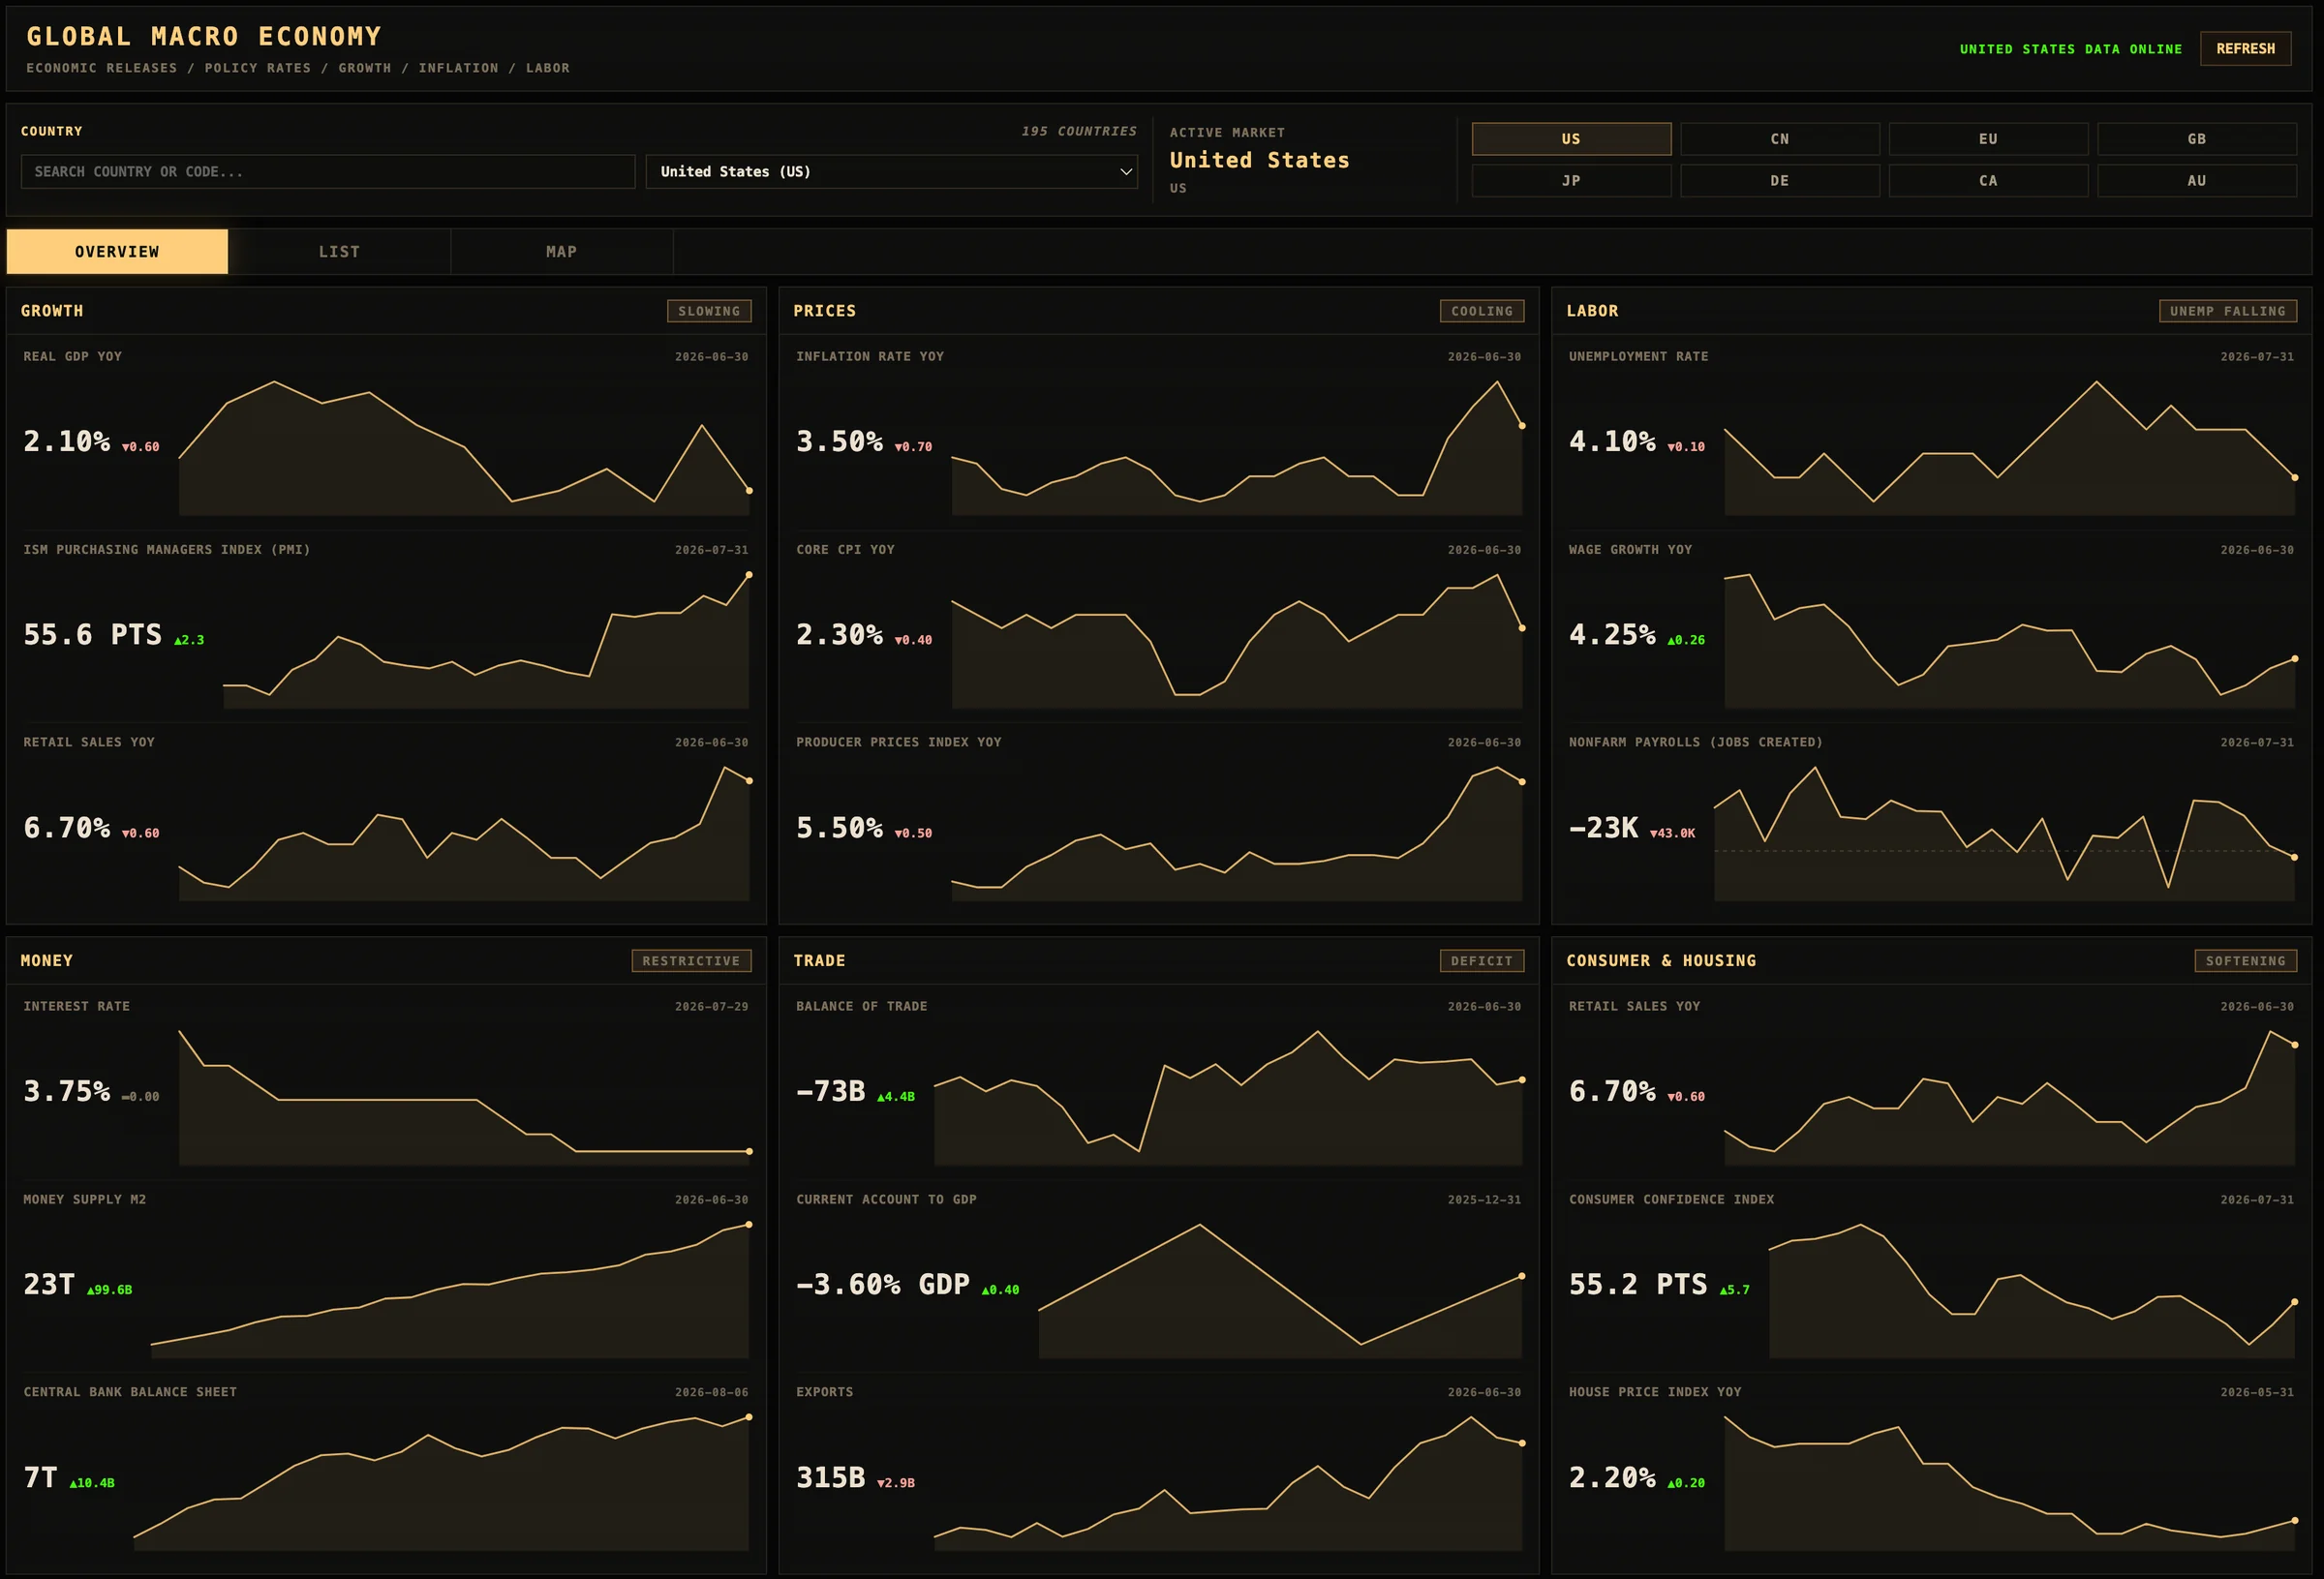
ANSWERS, NOT TEASERS
SEC EDGAR (Form 4, 13F, 10-K, 10-Q, 8-K and their XBRL facts), BLS and FRED for macro, CBOE and exchange feeds for prices and chains, and ETF issuer files for holdings. Every figure in the terminal keeps the accession number or series ID it came from plus the retrieval time. The SEC-derived pipelines are published as open source under secdata.
The web terminal is free with a registered account and runs on the same production data as the desktop app. The desktop terminal is a subscription with monthly and lifetime options. The public download opens with the release; the button on this page will change when it does.
Quotes intraday, options four times a session, news hourly, Form 4 daily, transcripts per call, statements per filing, 13F quarterly, macro per official release, index bars daily. The row counts on this page were measured on 2026-11-02, and each dataset states its own refresh cadence in the coverage table.
Screener sites show derived numbers without the formula or the filing. Resora keeps the statement rows, the accession behind each fact, the metric definitions used in comparisons, and 1990-onward insider and 1987-onward 13F history — plus the companies that got delisted, so a screen run today can be run against an universe that no longer exists.
Read-only endpoints are documented at resoraai.com/docs with curl examples and rate limits. Attribution is requested, and it is the only requirement.
No recommendations, no target prices, no sponsored content. Where an opinion-like view appears in the terminal it is a computed statistic with a stated formula, and you can check the inputs.
START WITH ONE REAL QUESTION